
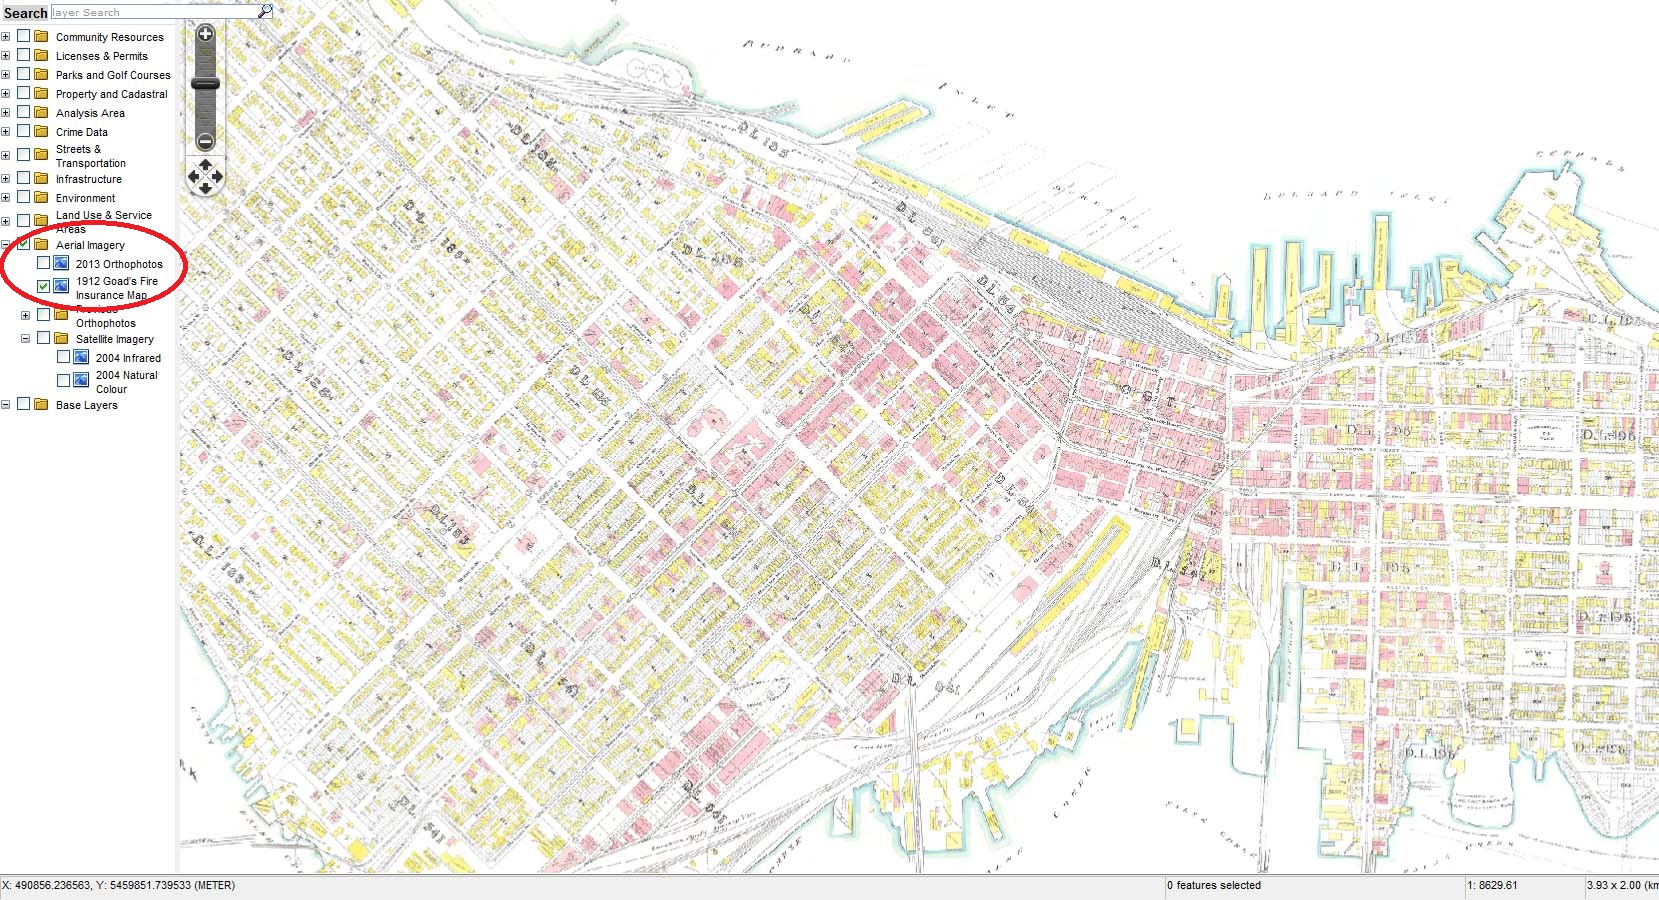
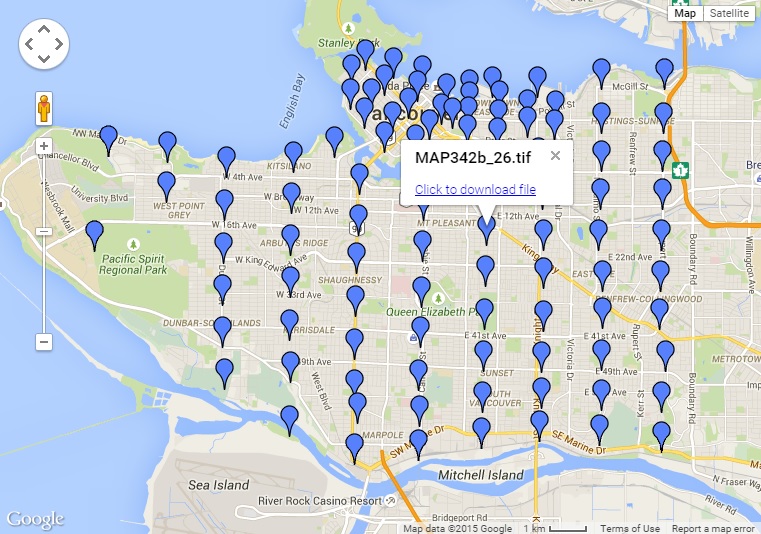
With funding from the City’s Chief Digital Officer and in collaboration with the City’s GIS and Open Data teams, there is now a Vanmap layer made from a mosaic of plates from Goad’s 1912 Fire Insurance Plan. You can find it in Vanmap’s Aerial Imagery category. The data has also been released as part of the City’s Open Data Catalogue. Cropping and georectification of the scanned images was done by McElhanney.
What is Goad’s Fire Insurance Map?
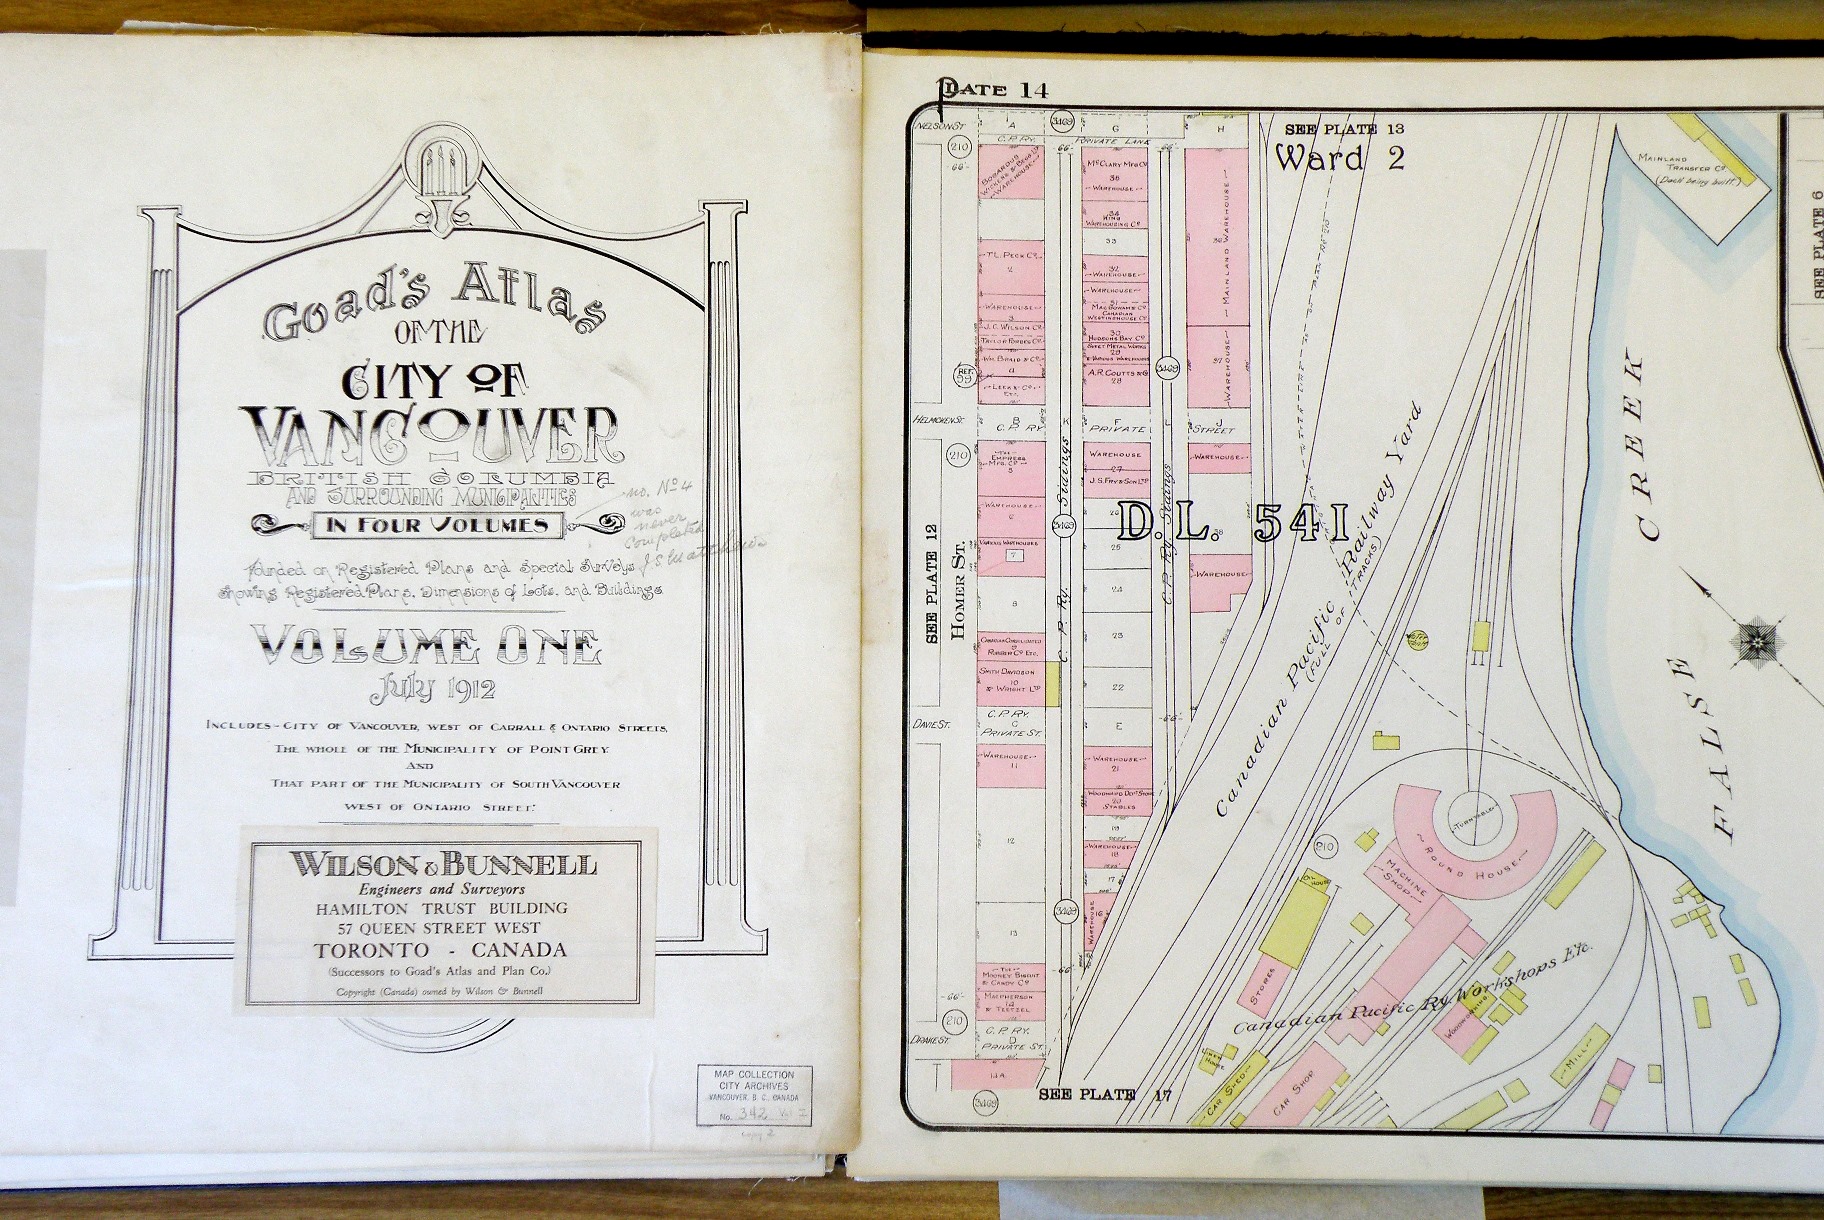
Fire insurance maps are created to depict information used to determine fire insurance liability. These maps typically include information on the materials used in a building and, for commercial buildings, the business that operated there if that use affected fire risk. This map was created by collecting information from approved Registered Plans filed with the Land Registry Office and on-site surveys. The plates, which are not all to the same scale, were bound into volumes and were originally used one page at a time: they were not made to be used as one large plan.
Although other companies created Fire Insurance Maps, the Charles E. Goad Company had an exclusive agreement starting in 1911 to supply maps for the Canadian Fire Underwriters’ Association. Goad’s maps are the ones most often found in Canadian archives. Historical fire insurance maps are used today to aid research into the histories of neighbourhoods and individual properties, particularly the changes in site use over time.
The Vanmap layer includes only the portion of the map within the boundaries of present-day Vancouver, although the published map shows other municipalities.
What kind of information does it contain?
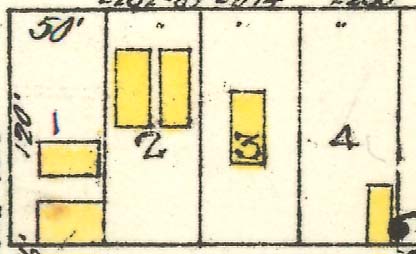
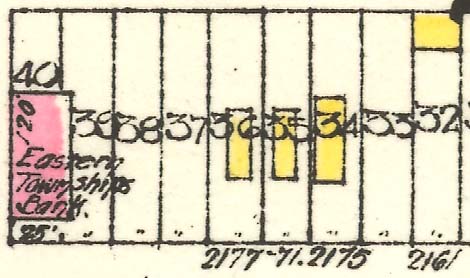
The map shows many types of information in detail.
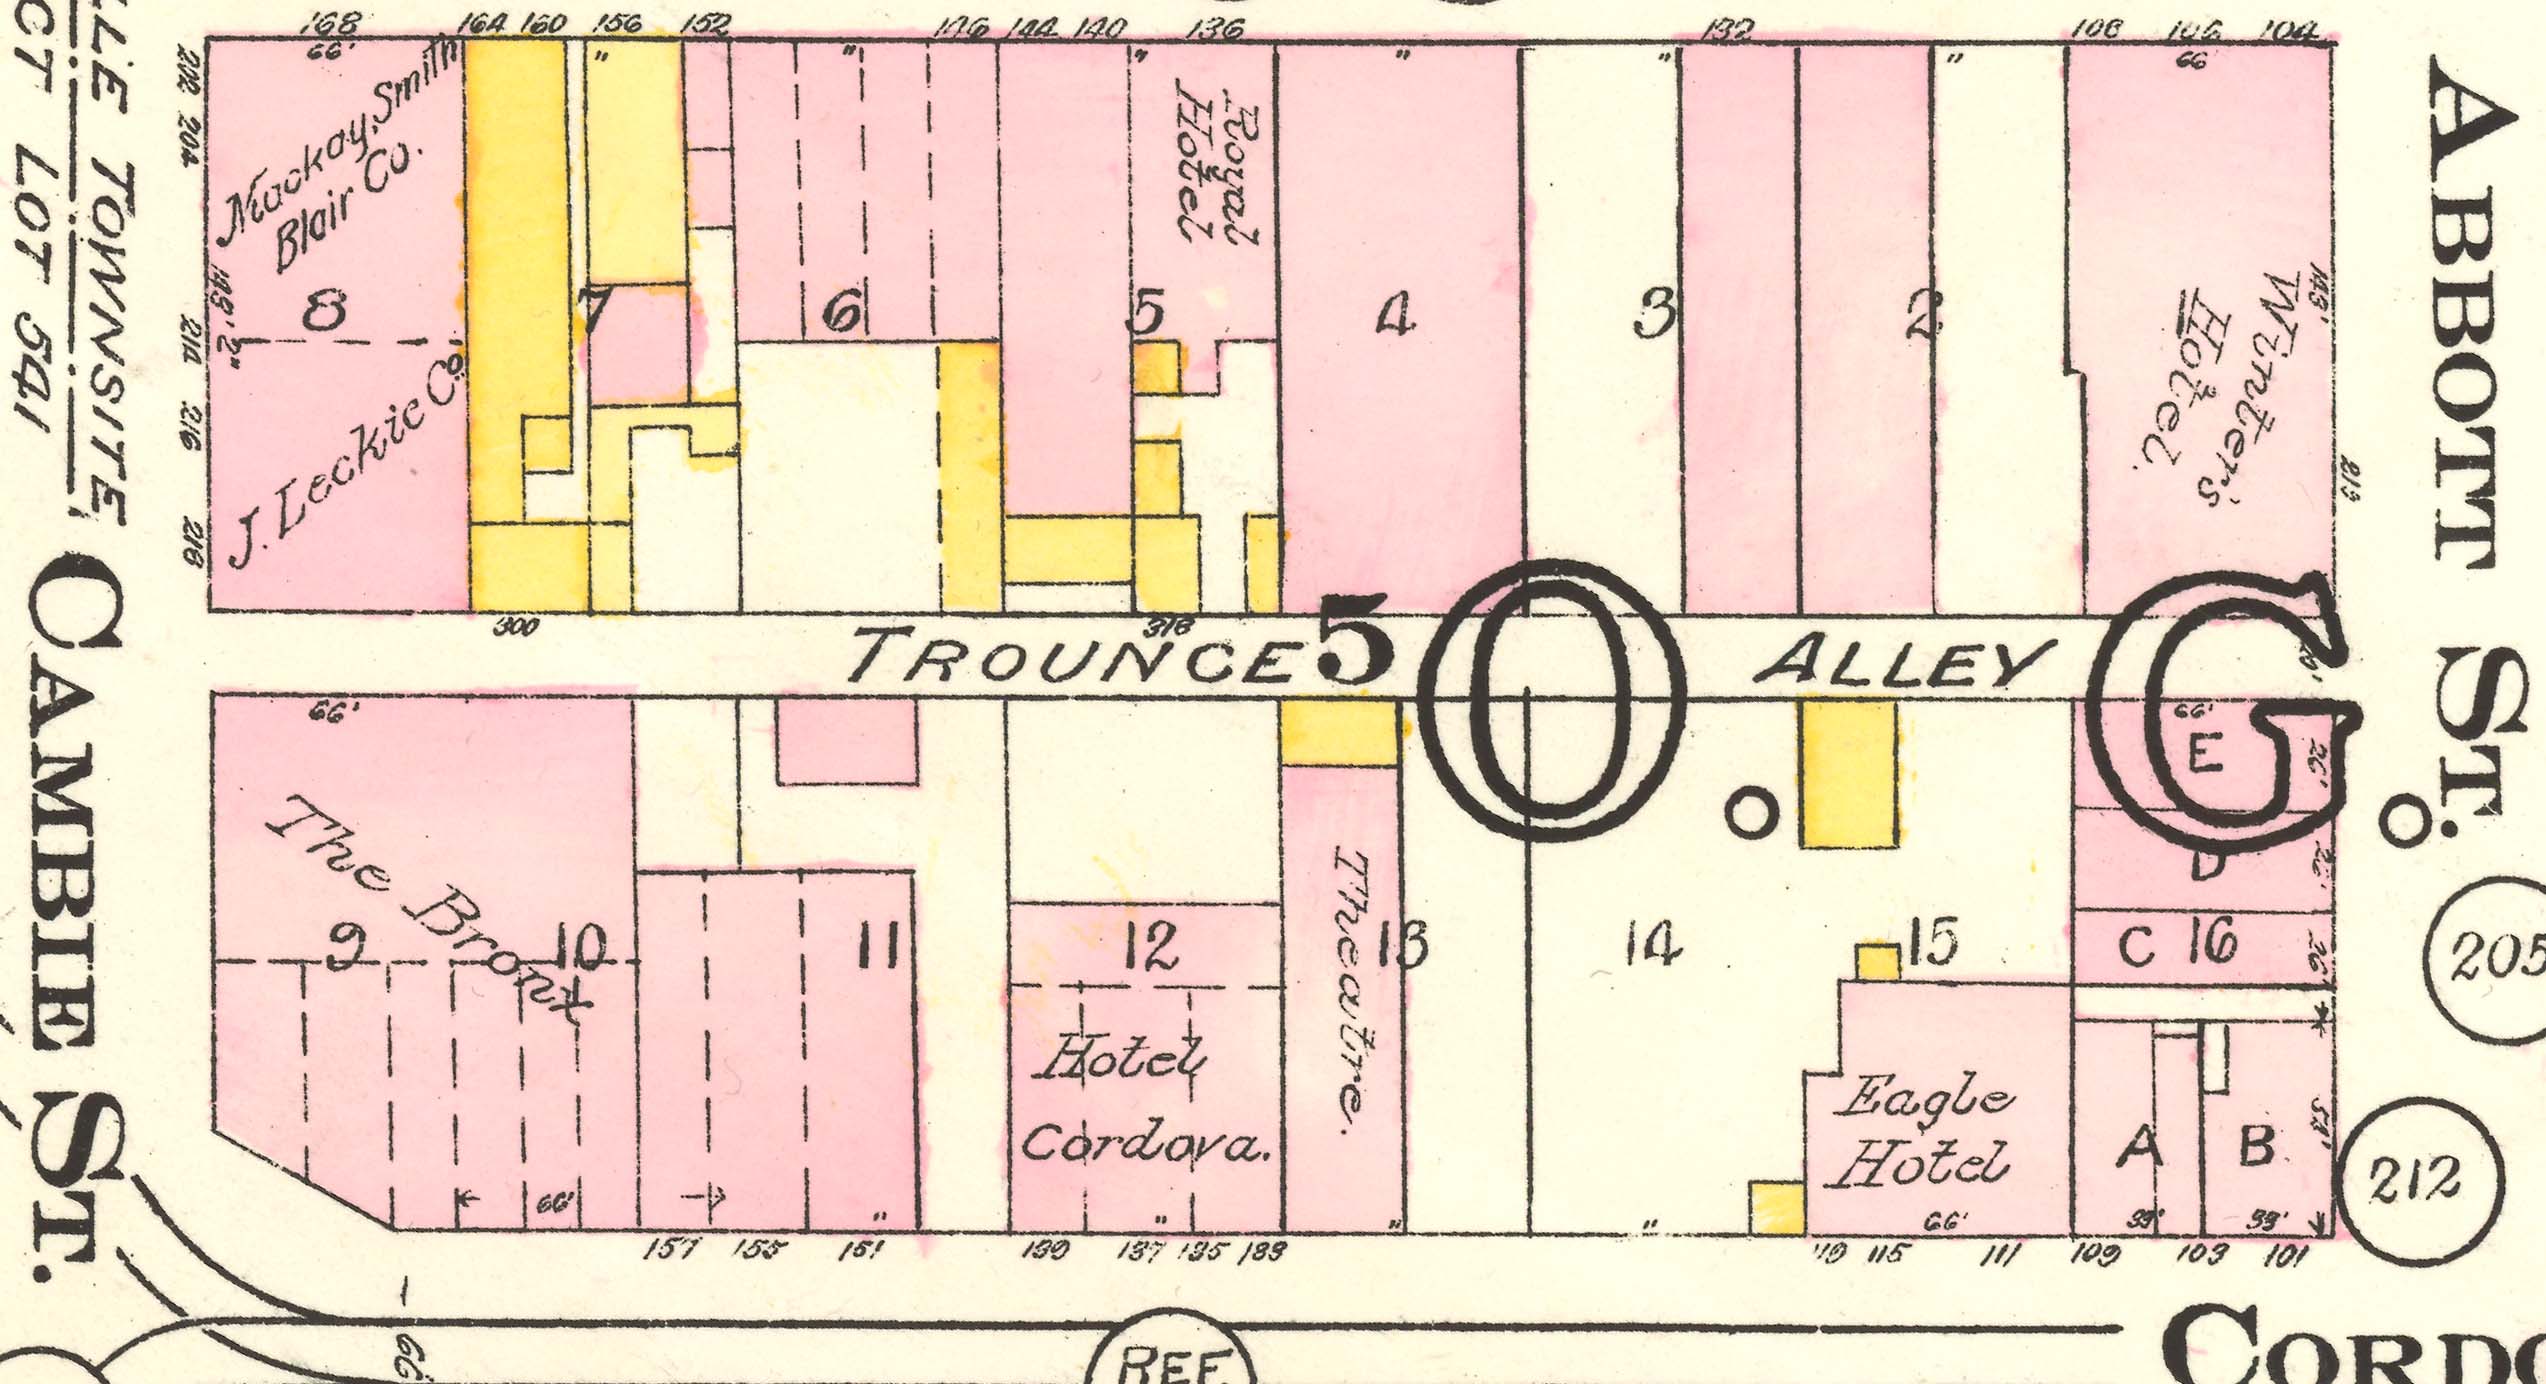
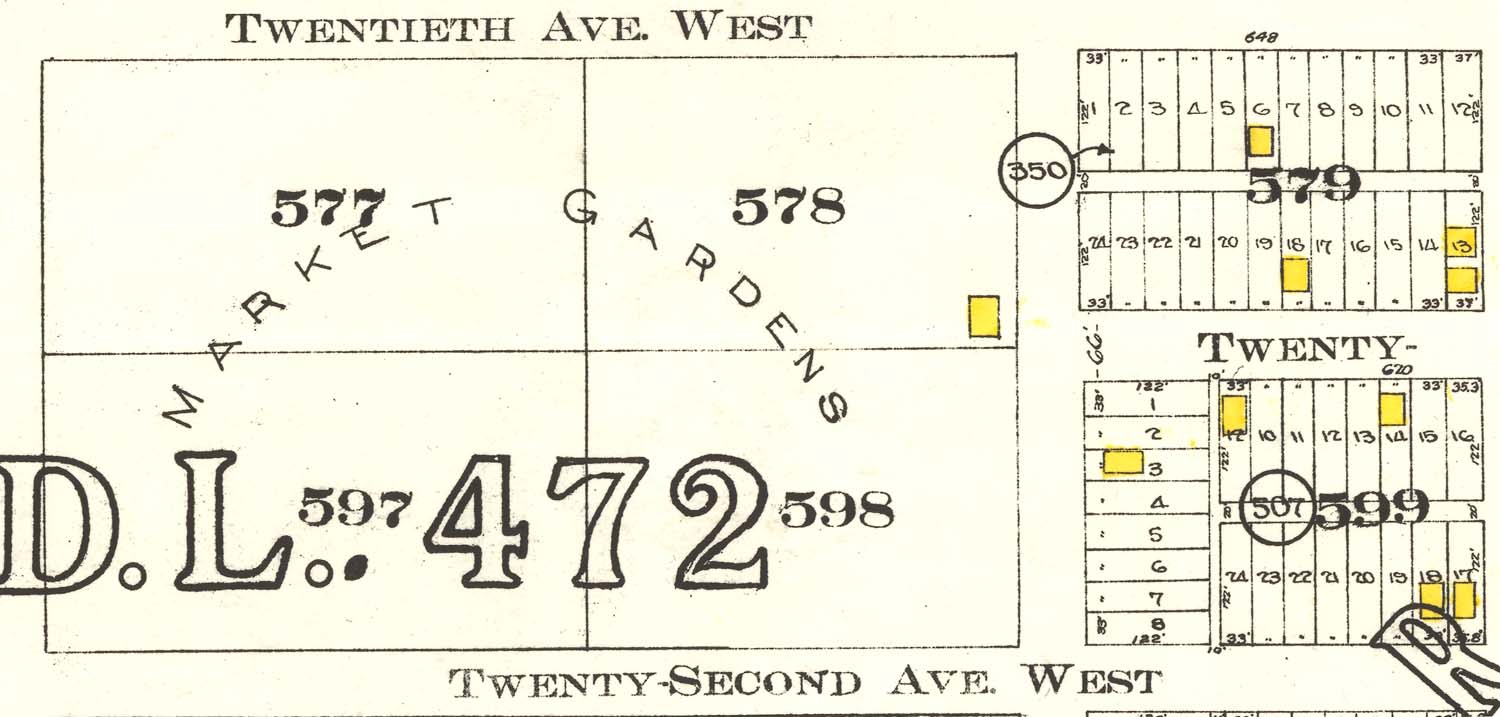
It shows the location, building materials and footprint of buildings. For commercial buildings, the name of the business is written on the plan. Buildings depicted in yellow are wooden buildings. Buildings depicted in pink are all other material types (brick, brick veneer, concrete, stone, etc.).
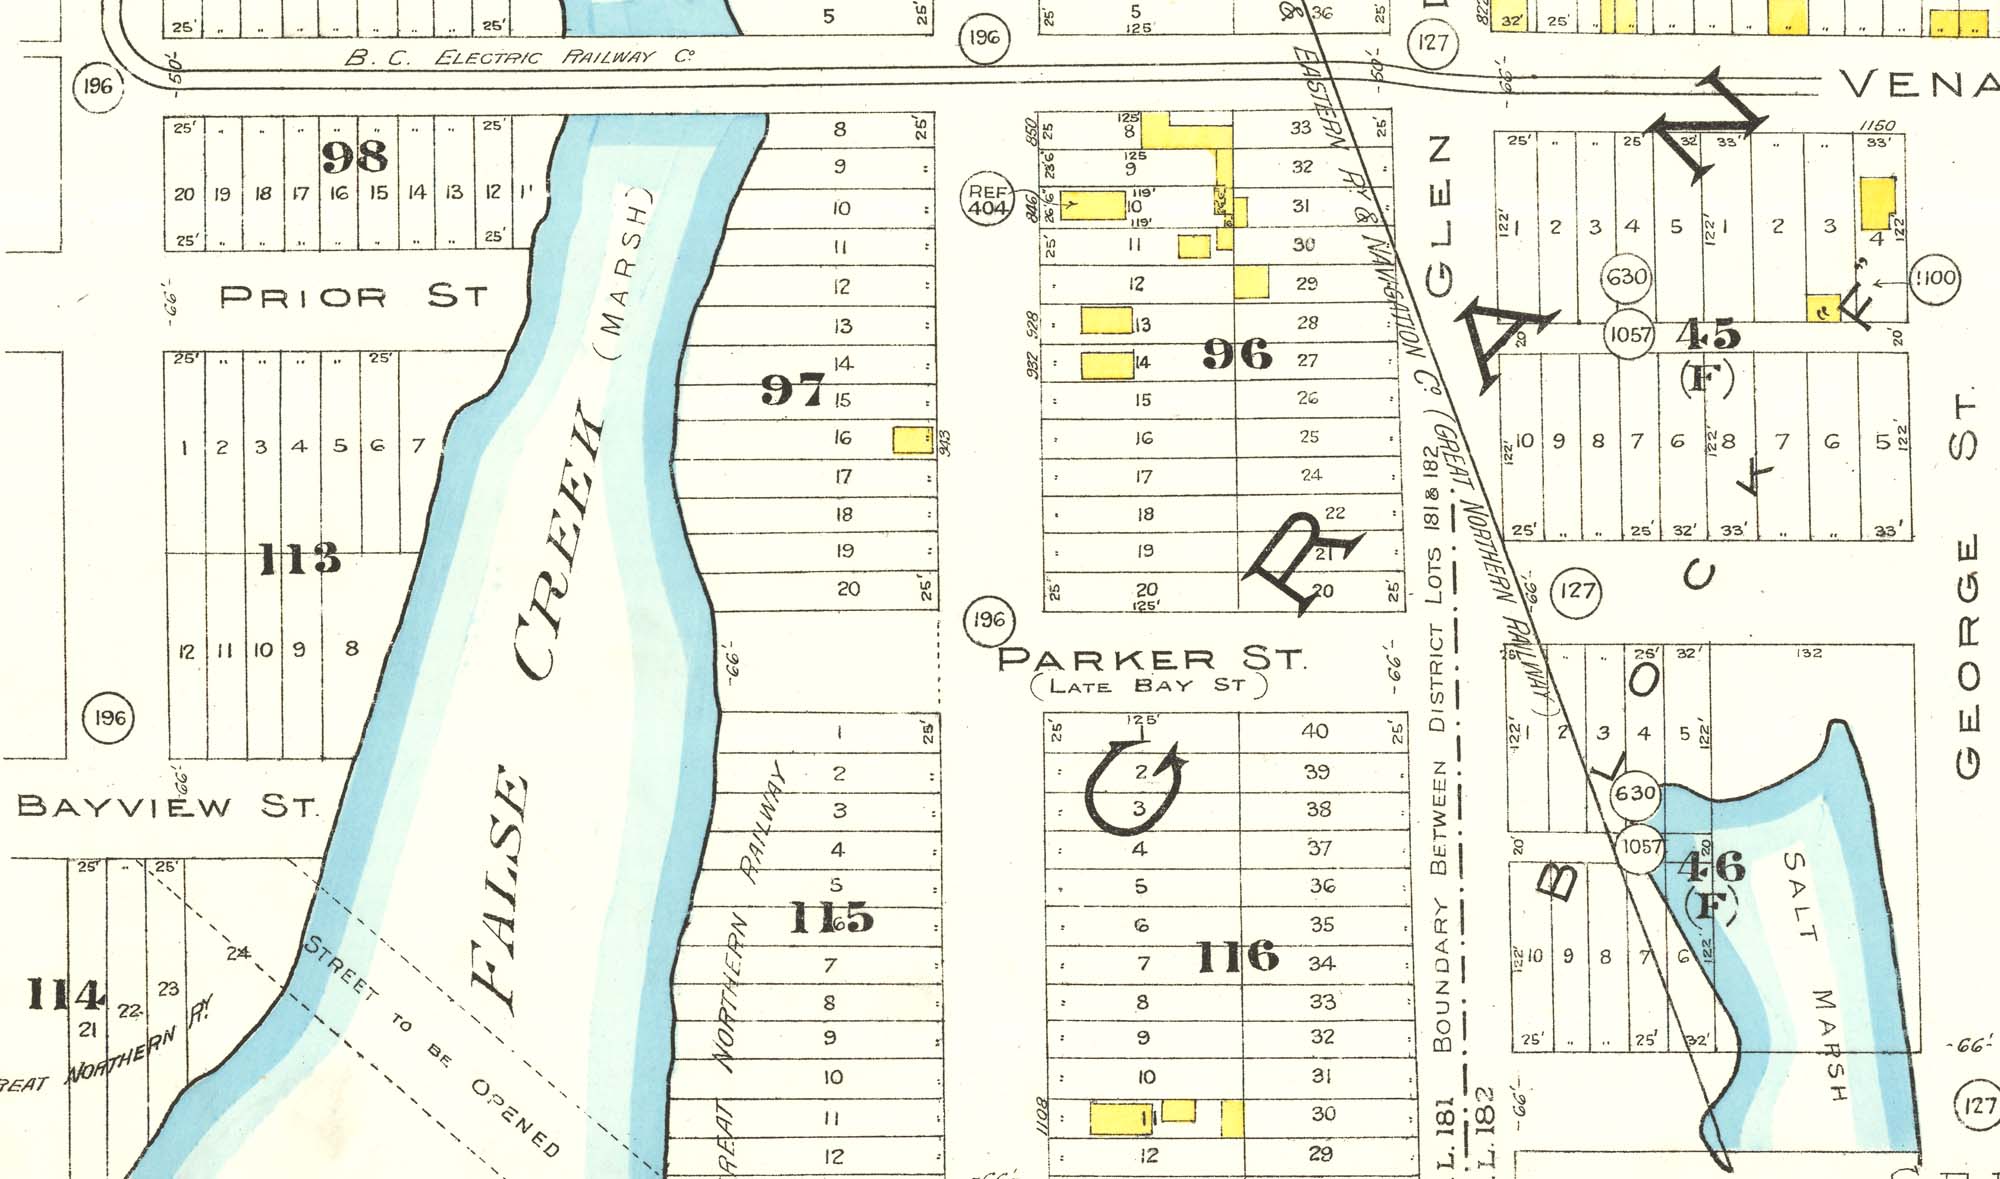
The original shoreline, where it differs from the 1912 shoreline, has been drawn in dashed lines, as have proposed future developments. You may have to turn off the Vanmap Shorelines layer to see all of the shore information.
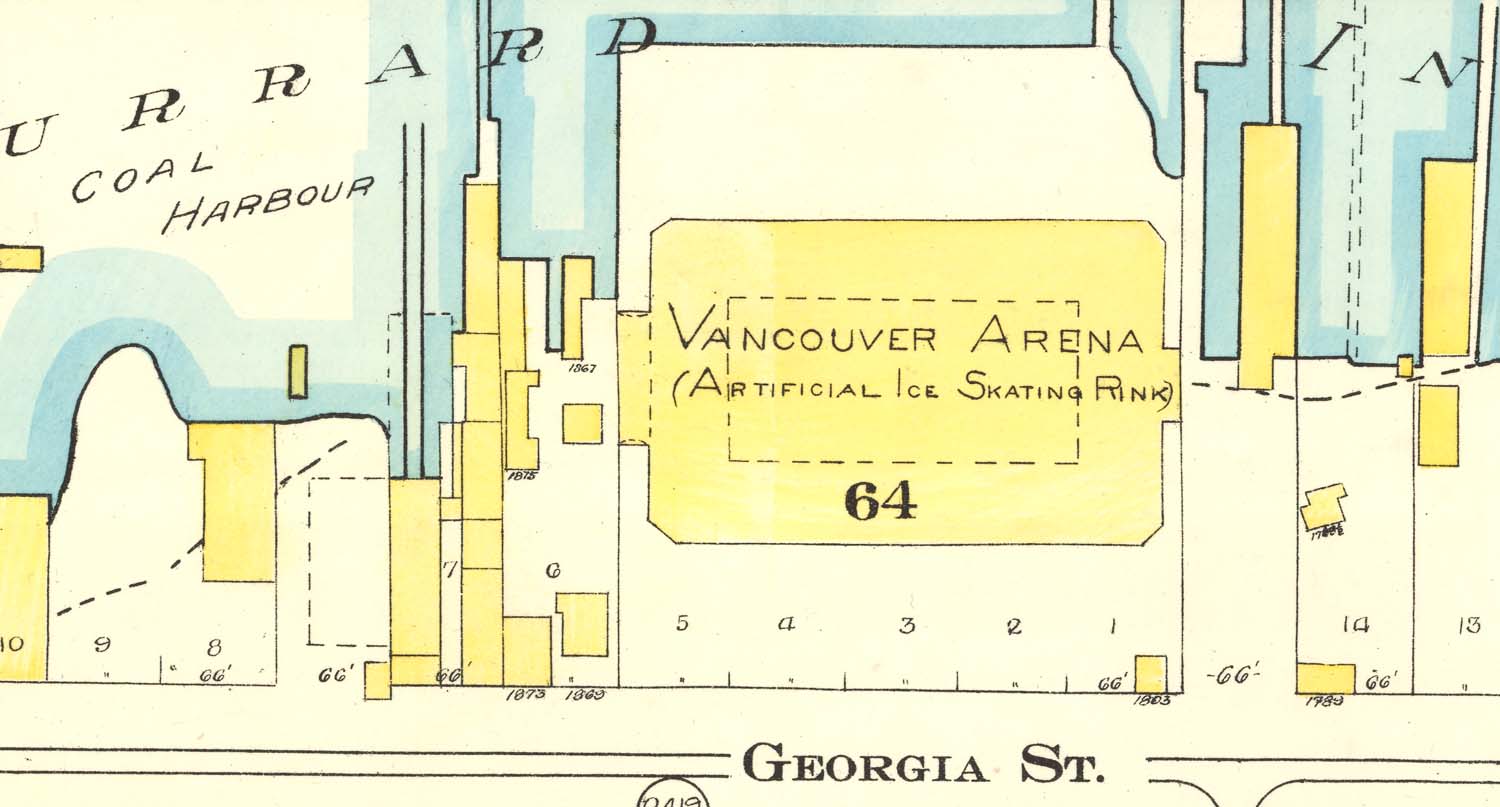
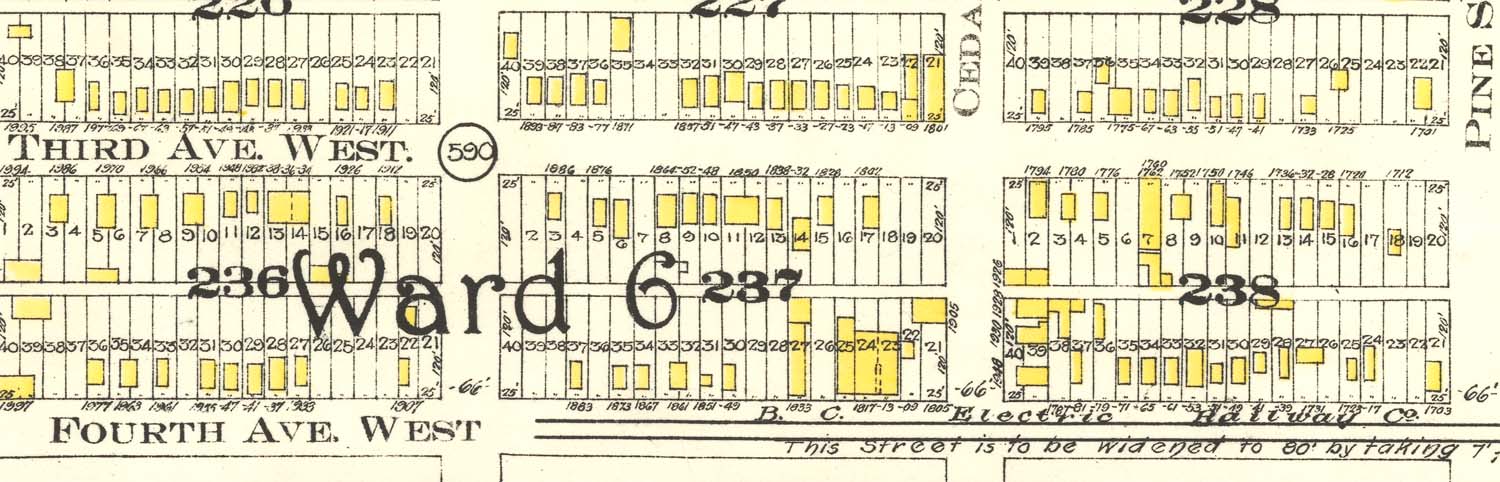
Electoral Ward information appears on the map. At the time, Vancouver used a ward system. BC Electric Railway lines are also shown.
The map contains many different numbers but they are easy to distinguish from each other. Some of the numbers on the map refer to where the information on the map came from, some refer to the legal land descriptions of the lots, and some are descriptive information about the lot itself.
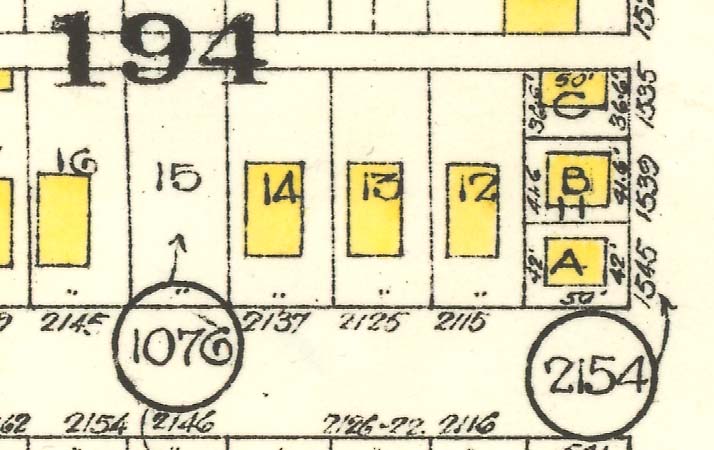
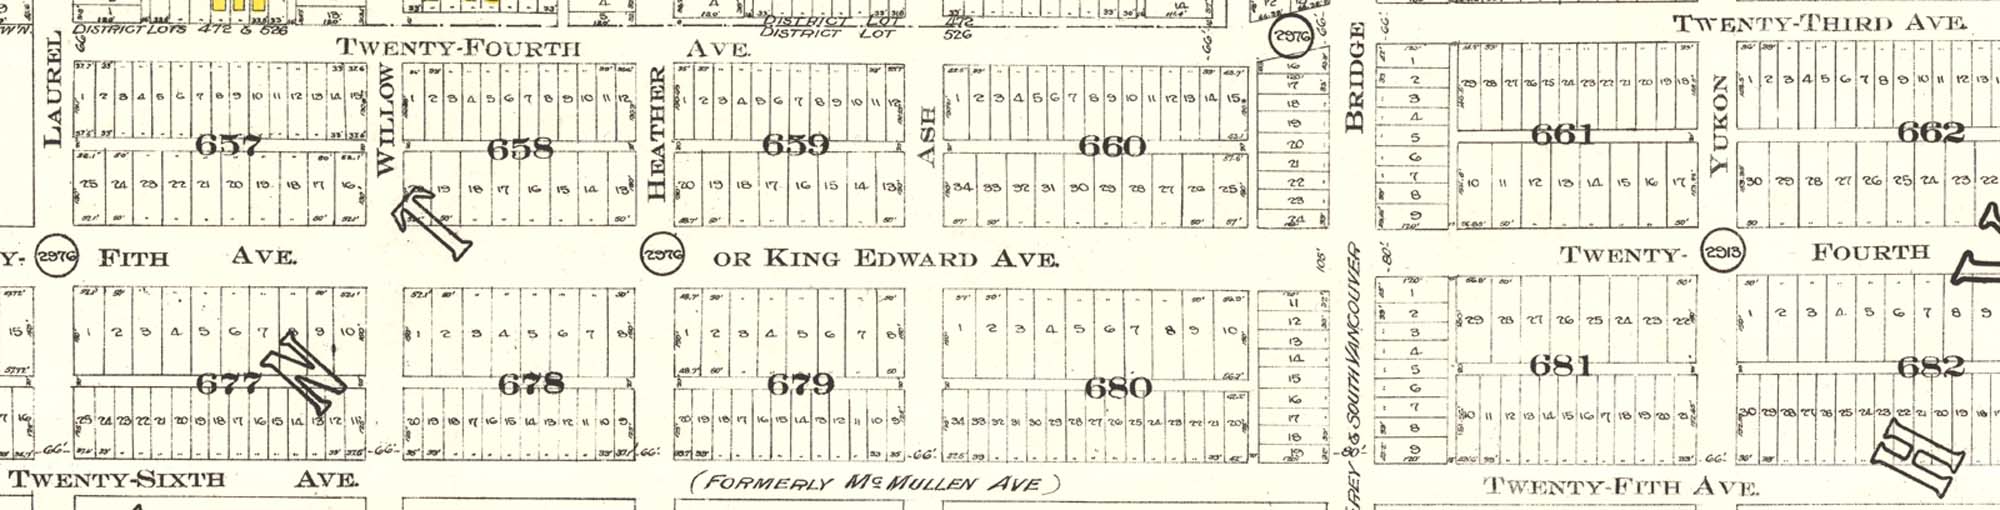
Many of the numbers on the map refer to legal land descriptions. Legal land descriptions are the unique identifiers for each registered parcel of land, assigned by the Land Registry Office. The legal land description is made up of the District Lot Number, Block Number and Lot Number. All of this information is noted for each lot on this map.
District Lots (marked as D.L. #) are the very large numbers on the map. Some District Lots are very large and multiple adjacent plates can depict one. Some plates depict all or part of multiple District Lots; the boundaries between District Lots are shown as dotted lines.
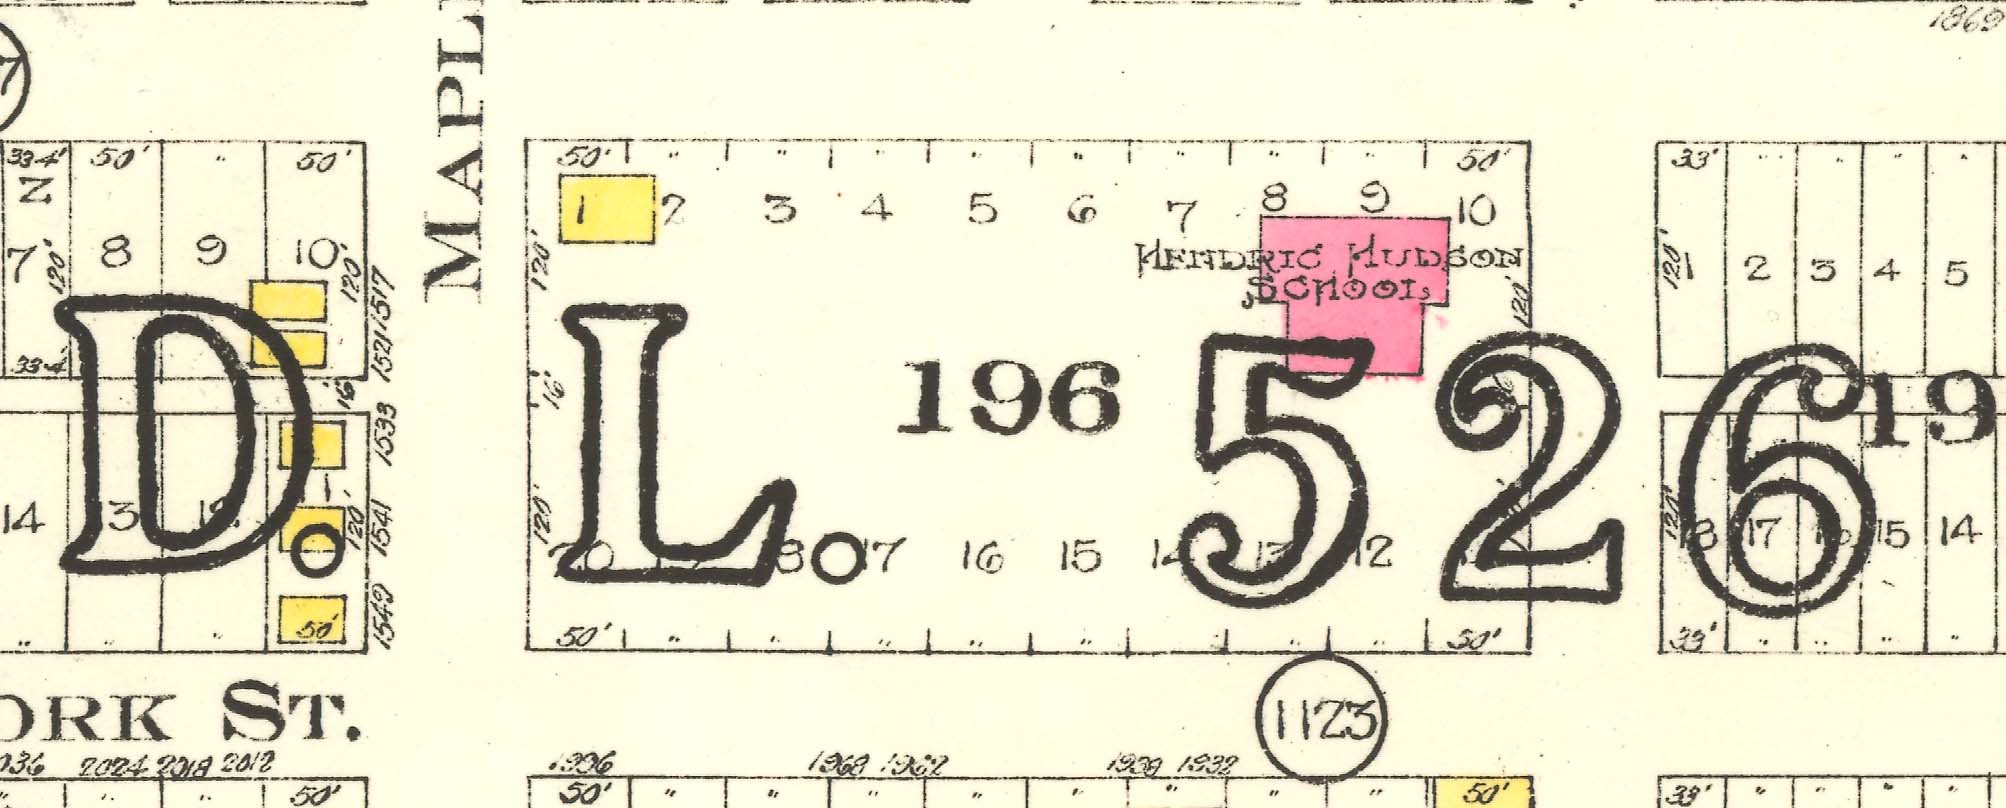
District Lots are subdivided into Blocks, each with its own number.
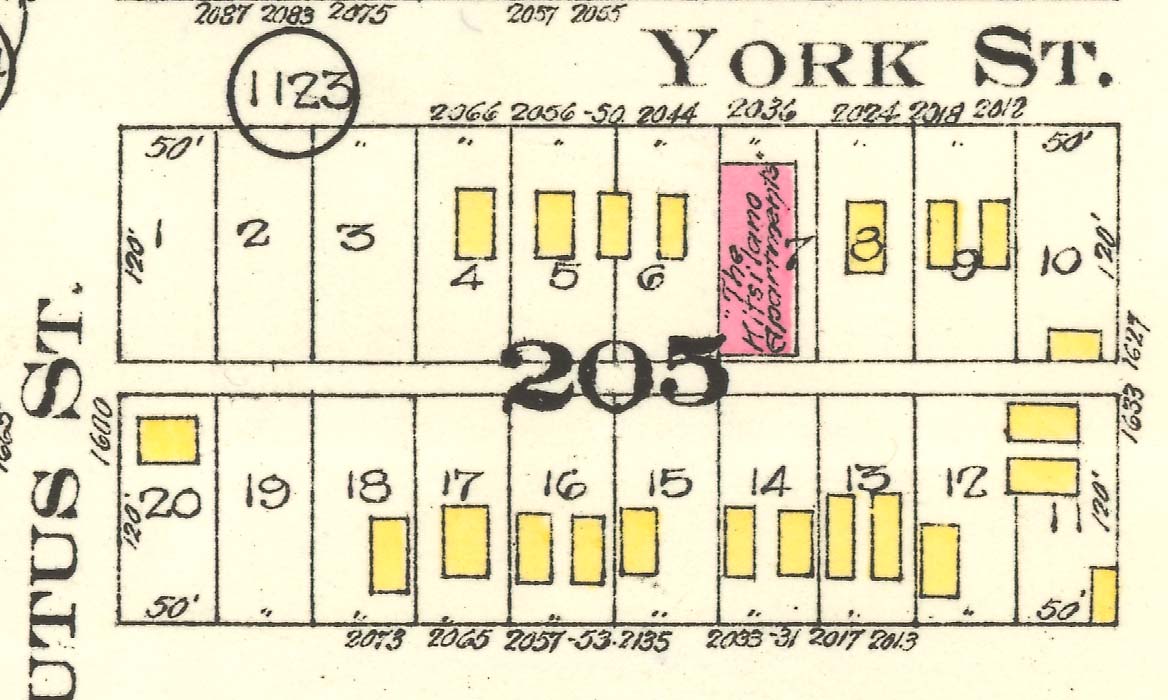
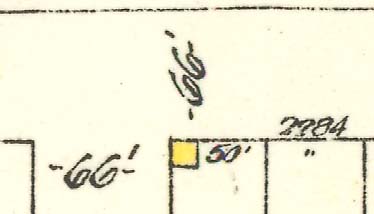
Blocks are divided into individual lots. Lots on the map can have multiple numbers drawn in or next to them. Numbers written in the centre of the lot represent the Lot Number component of the legal land description. Lot numbers can be a combination of digits and letters, if the initial lot has been subdivided after initial registration.
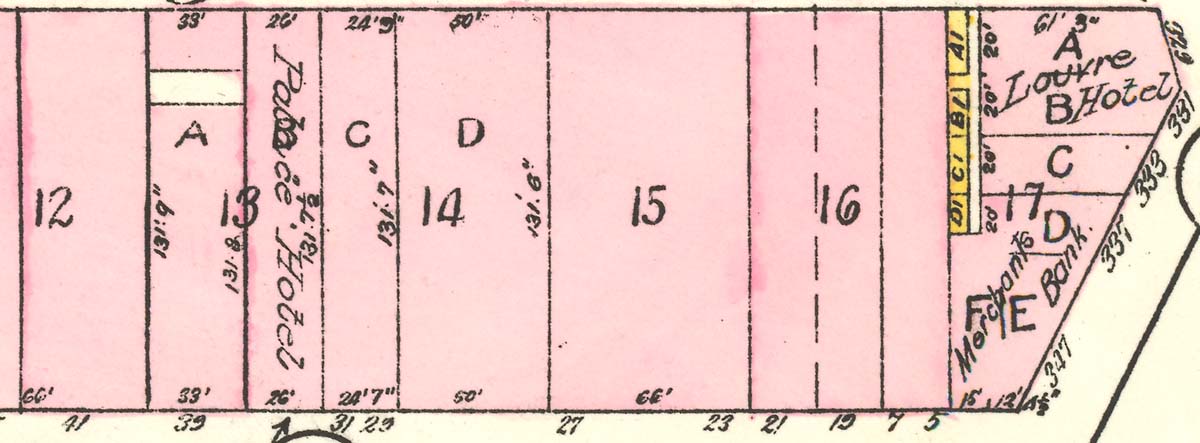
Numbers written along the inside perimeter of the lot show the lot dimensions. In areas where lots were a standard size, such as in some parts of downtown, some dimensions may be depicted as ditto marks (“); this means that dimension is the same as the lot above or to the left. Check along the row of lots to find the dimension value.
Numbers written in the space depicting the road in front of the lot show the street address at the time that the lot was registered. Note that street numbers change over time, especially when lots are divided or consolidated.
Numbers written in the middle of the road (e.g. –66’–) show the width of the road.
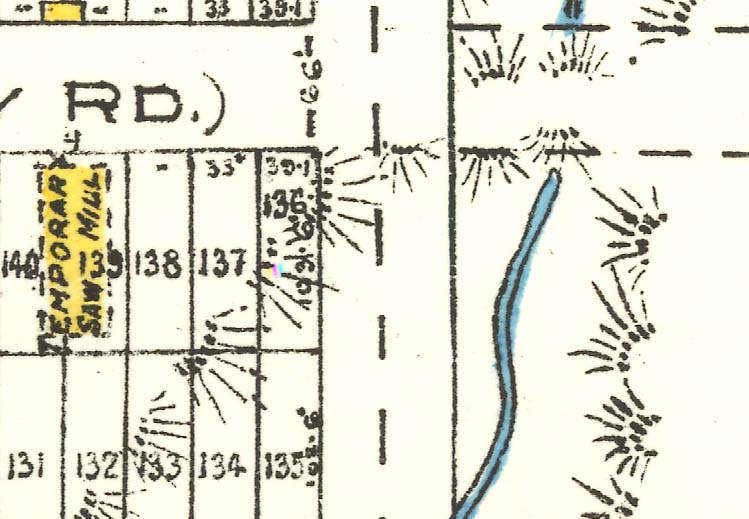
In 1912, Vancouver, Point Grey and South Vancouver were three separate municipalities. Street names shown reflect those of the day; many of the street names in the municipalities of Point Grey and South Vancouver were different before their amalgamation with Vancouver in 1929. Some streets in Point Grey also have current and historical names noted. After Point Grey separated from South Vancouver in 1908, some street names were changed.
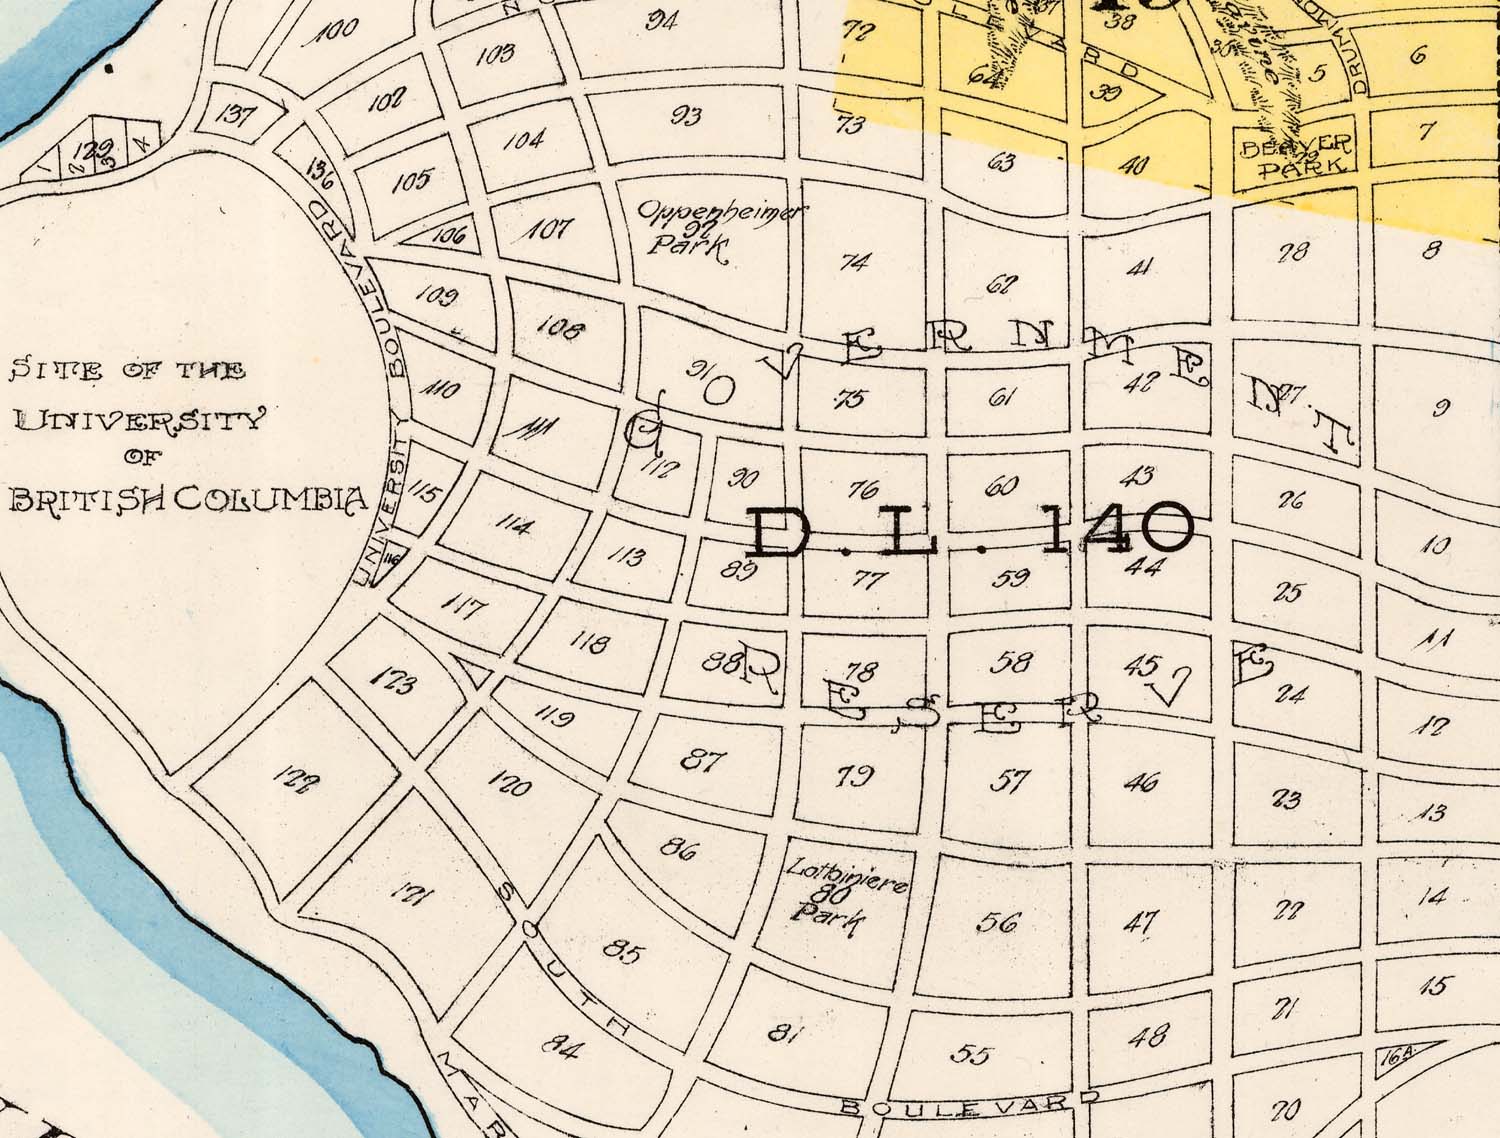
The street network in areas undeveloped in 1912 reflects what municipalities might have planned to build, but in some cases did not end up constructing. Of particular note are the University Endowment Lands and south-east Vancouver, where what this map depicts bears no relation to what was actually built when those areas were developed decades later.
Why pick the 1912 map?
The 1912 map is rich with information. District Lot 301 and Hastings Townsite had both been annexed by the City of Vancouver in 1911, and old street names are shown. As noted above, the old street names used in Point Grey before 1908 are also shown.
We have all the plates for the Vancouver portion of the 1912 map, and they are in good condition. This map is in the public domain, so we are free to create with it.
What else does it have?
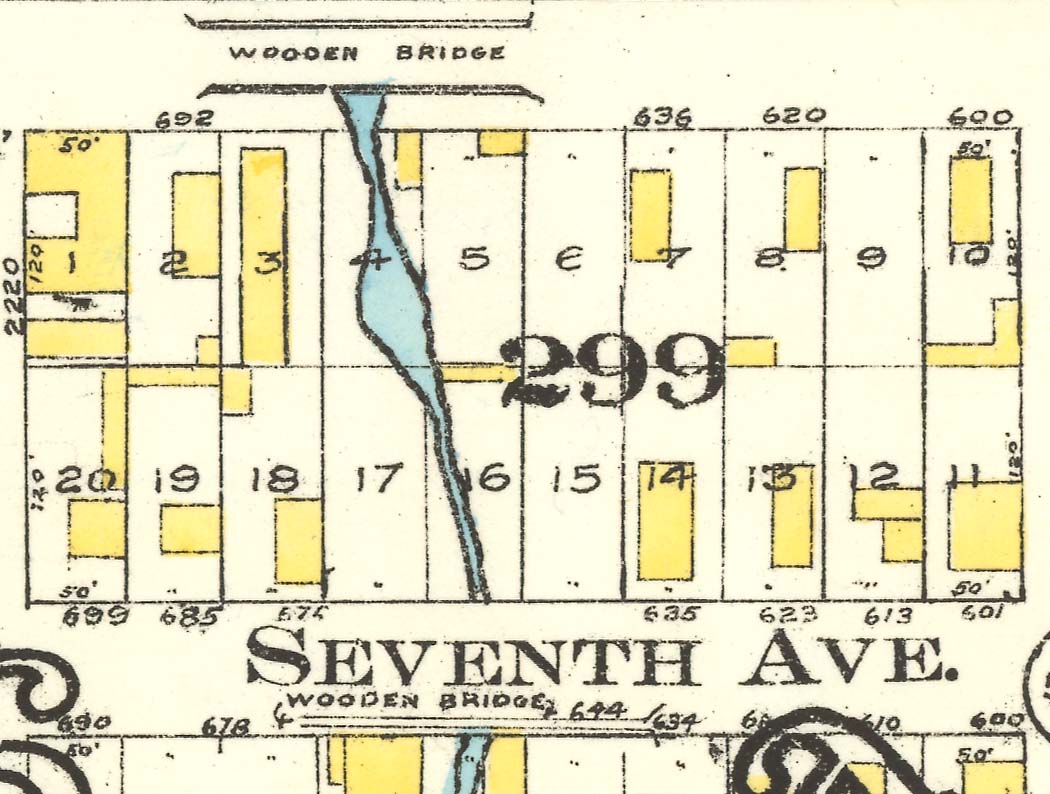
This map contains a few nice surprises. The old streams and creeks are shown as exposed waterways, with bridges across them at some points.
There were blocks devoted to market gardens in Point Grey.
Land was still being cleared for development. A temporary sawmill is shown in South Vancouver between Wales St. and Vivian St. and 64th Ave. and 65th Ave., near “thick bush”.
False Creek extends as far as Grandview. It was not filled in until later in the decade.
Anything there that’s not perfect?
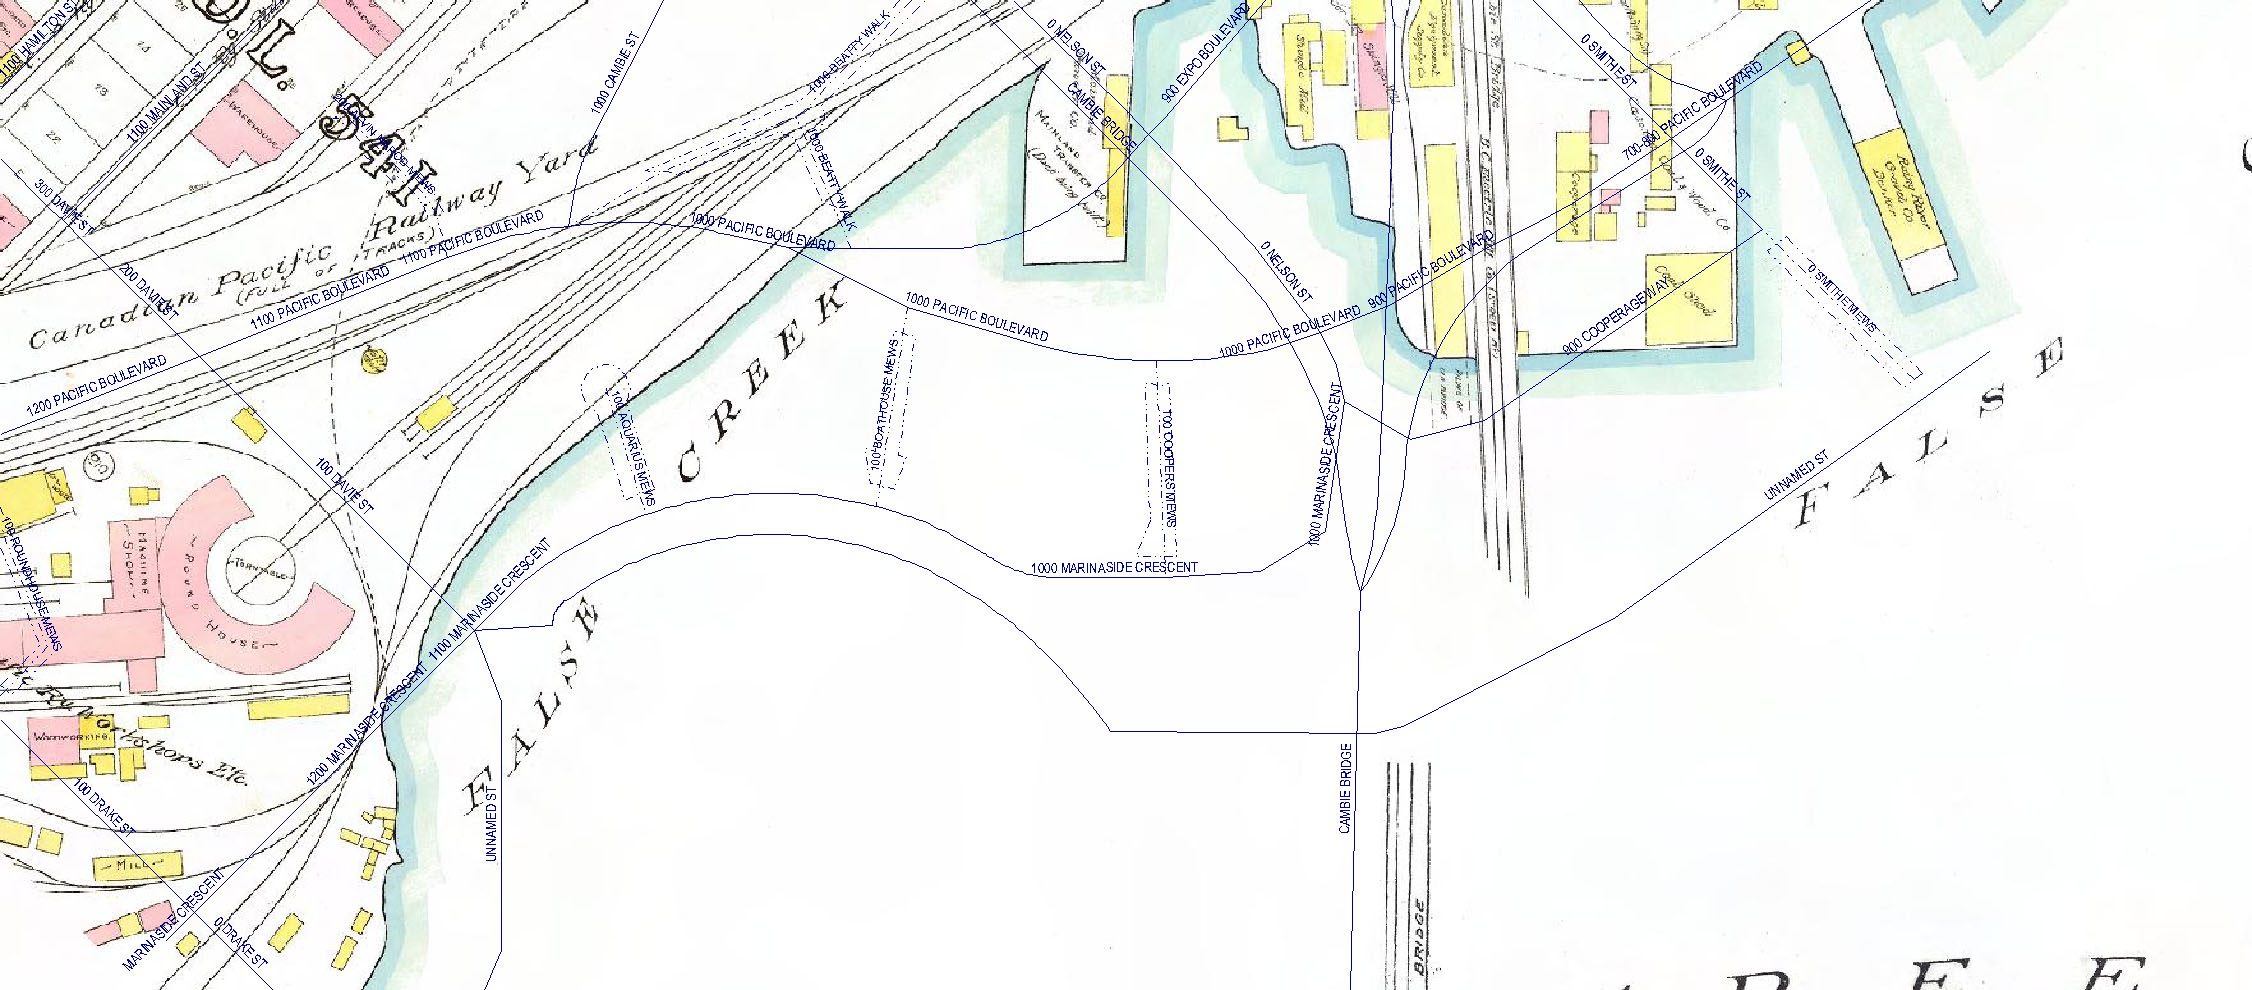
The plates of the map were never meant to be fitted together as one large image. We’ve tried to align them with the current street grid, where appropriate, but sometimes things don’t line up. It would be expensive to make everything perfect.
Stanley Park was not included in the Vanmap layer because it’s not part of the map.
Open data
We’re releasing the georectified map through the City’s Open Data Catalogue. You can download the entire mosaic as a single zipped file in ECW format. You can also download individual polygons in both ECW and TIF formats.
We hope you enjoy strolling the virtual streets of 1912 Vancouver. Please join us at the launch this Saturday.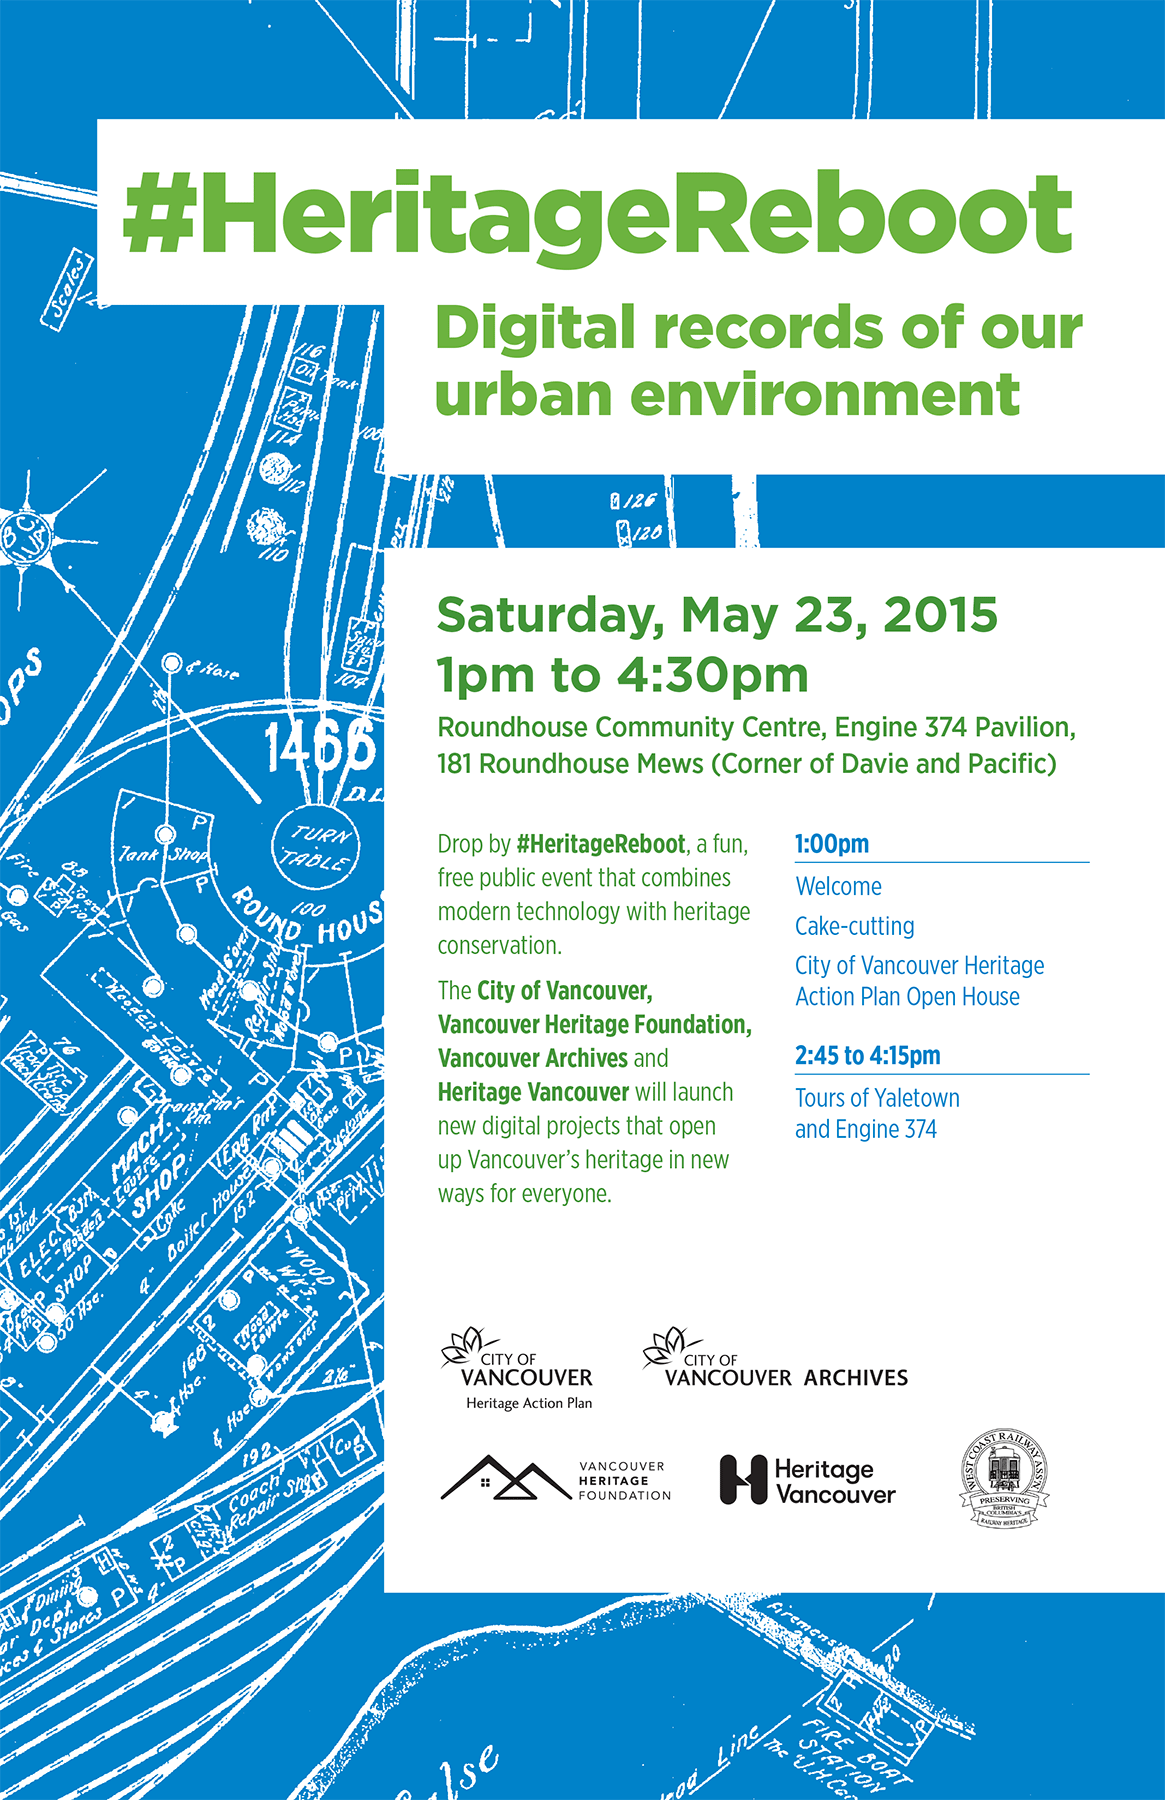


Fantastic! What a boon to researchers. Well done!
Hi!
This is a fantastic and wonderful effort!
Is there a wms URL for the 1912 map tiles? It would be great to have this, as it would make it easier for people to start extracting the metadata from this map and then start linking to other resources, like old pictures, etc.!
Thanks! Jeff
Please save these images as .PNG and not .JPG. Artefacts are ruining them. PNG should be used for images with lots of lines and text.
Do you mean the images in the blog post? We intended those for illustration only, not reuse. The open data is TIFF and ECW; I think ECW was used in VanMap.
There isn’t a WMS, but we would be happy to upload the tiles to one. We are looking into this and would appreciate recommendations.
Heather,
You can upload to http://mapwarper.net/ where the images can then be georectified. Let me know if you have any questions via email.
Cheers!
We worked with the BC Developers’ Exchange to get the 1912 Goad’s into a wms. More here: http://www.vancouverarchives.ca/2015/10/01/putting-the-goads-1912-plan-into-open-historical-map/ If you would like to help out by starting on extracting vectors, that would be wonderful!
Charles E. Goad and his successor companies produced great numbers of fire insurance plans. Canada and the UK are well covered. There are a dozen towns in the Caribbean, a few in South America and Africa, and many more from Scandinavia to France, Egypt and Turkey.
But the 1912 Vancouver Atlas is not a fire insurance plan, and was never intended to be one. It is more properly a Property Atlas.
Fire insurance plans, and in the United States fire insurance maps, have symbols and signs that indicate a building’s vulnerability to initiating a fire within, catching fire from without, spreading fire to its neighborhood. Also there are similar signs and symbols that show the community’s ability to suppress a fire – fire departments, water sources, fire alarm boxes. And much more.
Bill Raymond
Fresno/Berkeley
California
Thank you, Bill. You’re quite correct, and we’re gradually amending our references to the atlas to reflect the proper nomenclature and use.
‘Looking for an early Goad Fire Map encompassing 21st Street and Bellevue Avenue in West Vancouver.
Have you tried contacting the West Vancouver Museum and Archives? If there is one that early for that area, they would probably know.